Network Monitoring
What is Network Monitoring?
Network monitoring is the process of observing and analyzing network infrastructure, devices, and traffic to ensure optimal performance, availability, and security. It involves collecting and analyzing data to gain insights into the network's health, identify slow traffic and potential issues, and facilitate efficient network management.
For end-to-end visibility, a comprehensive network monitoring solution will typically cover components such as switches, routers, firewalls, servers, and software services that are critical to network availability and performance.
What are the main areas of focus for Network Monitoring ?
Network monitoring usually covers these key areas:
- Performance Monitoring: Tracking performance metrics such as bandwidth utilization, latency, and response times to understand the network's performance levels.
- Device Monitoring: Monitoring the status and health of network devices to detect failures, errors, or performance degradation.
- Traffic Monitoring: Capturing and analyzing network traffic patterns to identify bottlenecks, slow traffic, congestion, or abnormal behavior.
- Fault Monitoring: Detecting and notifying administrators about network faults, errors, or events that impact performance or availability.
- Security Monitoring: Detecting and mitigating security threats by monitoring network traffic for suspicious activities, intrusion attempts, and unauthorized access.
How does Network Monitoring work?
Network monitoring works by continuously collecting and analyzing data from various network devices, systems, and traffic flows. The process typically involves the following steps:
- Data Collection: Network monitoring tools gather data from different sources within the network. This can include network devices such as routers, switches, firewalls, and servers, as well as network traffic flows and system logs. The data collected may include performance metrics, traffic statistics, error logs, device statuses, traces and other relevant information.
- Data Analysis: Once the data is collected, it is analyzed to gain insights into the network's performance, health, and security. Modern monitoring tools such as eG Enterprise employ AIOPs technologies and include algorithms, statistical analysis, and machine learning techniques to process and interpret the data. This analysis can involve comparing data against baselines, identifying patterns or anomalies, and calculating metrics such as response times, bandwidth utilization, packet loss, and error rates.
- Alerting and Notification: Network monitoring tools can be configured to generate alerts and notifications based on predefined conditions or thresholds. When a monitored metric exceeds or falls below the set threshold, an alert is triggered to notify network administrators or operators. Alerts can be sent via email, SMS, or integrated into a centralized monitoring console or helpdesk and ITSM systems such as ServiceNow, ensuring timely notification of potential issues or critical events. In modern tools such as eG Enterprise, dynamic thresholds and alerting are configured out-of-the-box removing the need for manual configuration.
- Visualization and Reporting: Modern network monitoring tools such as eG Enterprise provide out-of-the-box visualizations, dashboards, and reports to present the monitored data in a user-friendly format. This helps administrators easily understand the network's status, performance trends, and potential areas of concern. Visualizations include graphs, topology maps and other visual representations to provide a clear overview of the network's health and performance.
- Troubleshooting and Remediation: Network monitoring data serves as a valuable resource for troubleshooting and remediation. When issues are detected or alerted, administrators can use the collected data to identify the root cause of the problem. This can involve analyzing network traffic patterns, examining device logs, and correlating data from different sources. Once the issue is identified, administrators can take appropriate actions to resolve it, such as reconfiguring network devices, adjusting settings, or addressing network congestion. The AIOps driven root-cause diagnostics within eG Enterprise automatically identify the root-cause of issues and collect additional diagnostic information automatically removing the need for manual analysis.
- Performance Optimization and Planning: Network monitoring data is utilized for performance optimization and capacity planning. By analyzing performance metrics, administrators can identify areas for improvement, optimize network configurations, and allocate resources effectively. Additionally, historical data and trends can be used to anticipate future network needs, plan for capacity upgrades, and ensure the network is prepared for future growth and demands.
How do Network Monitoring tools collect metrics?
When monitoring a computer network and networking devices, several common standard protocols can be used to collect data and monitor their performance. The most common include:
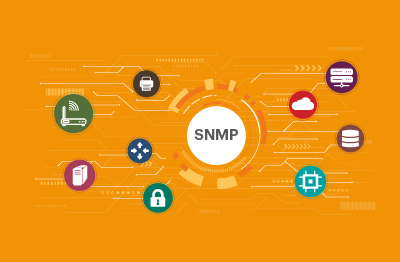
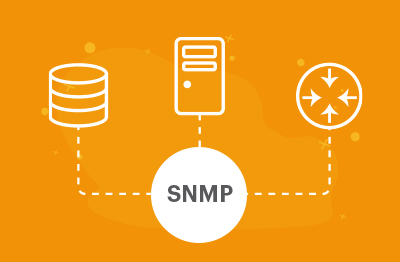
- SNMP (Simple Network Management Protocol): SNMP is probably the most widely adopted protocol for network monitoring and management. It allows network devices, such as routers, switches, and servers, to be monitored and controlled by a central management system. SNMP provides a framework for collecting and organizing data using Management Information Bases (MIBs). It supports various versions, including SNMPv1, SNMPv2c, and SNMPv3. Read more about eG Enterprise’s extensive support for both standard and proprietary MIBs, see What is SNMP & Why is SNMP Still Relevant - IT Glossary | eG Innovations, and SNMP Monitoring Made Scalable, Reliable, and Extensible (eginnovations.com)
- ICMP (Internet Control Message Protocol): ICMP is a network protocol used for diagnostic and control purposes. It is primarily used for monitoring network connectivity and troubleshooting. ICMP includes messages such as Echo Request (ping) and Echo Reply, which can be used to check the availability and round-trip time of network devices.
- NetFlow: NetFlow is a network protocol developed by Cisco Systems. It collects information about network traffic flows, including source and destination IP addresses, ports, protocols, and the volume of data transferred. NetFlow data provides valuable data into network traffic patterns, bandwidth usage, and application-level statistics. Those reliant on Cisco infrastructure will invariably benefit from using a product with dedicated support for NetFlow, see: NetFlow Analyzer and Bandwidth Monitoring - IT Glossary | eG Innovations.
- Syslog: Syslog is a standard protocol used for logging and transmitting system and network event messages. It allows network devices to send log messages to a centralized syslog server for monitoring and analysis. Syslog messages provide information about device status, errors, warnings, and other important events.
- HTTP/HTTPS: Hypertext Transfer Protocol (HTTP) and its secure variant (HTTPS) are commonly used for monitoring web-based services and applications. They allow for monitoring web servers, checking response times, retrieving specific web pages, and verifying the availability of web services.
- SSH (Secure Shell): SSH is a cryptographic network protocol that provides secure access to remote devices over an unsecured network. It is commonly used for monitoring and managing network devices, especially when configuring or retrieving information from them securely.
Beyond protocols a great deal of useful information on network usage can be obtained by leveraging vendor APIs and / or the use of a lightweight agent. This can be an important strategy to overcome scalability or security challenges associated with some protocols such as SSH.
These are just a few examples of common protocols used in network monitoring integrated within eG Enterprise out-of-the-box. The choice of protocols depends on the specific monitoring requirements, the devices being monitored, and the capabilities of the monitoring tools or systems in use. With an enterprise monitoring tool such as eG Enterprise the system administrator is relieved of the substantial task of choosing the best collection mechanism, tunning sampling and so on.
Enterprise monitoring tools also offer support for proprietary formats from the major vendors such as Cisco, F5, HP, Huawei, Hitachi, IBM, and so on.
What are the benefits of effective Network Monitoring?
Network failures or slowness will impact IT effectiveness and ultimately end users' ability to work effectively. There are many benefits to an organization that justify the investment in good network monitoring tools, business benefits include:
- Cost Savings: Downtime costs businesses money and stops employees working or prevent customers spending with products. Proactive monitoring can avoid downtime, moreover automated root-cause diagnostics reduces the length of outages by reducing MTTR. Automated diagnostic tools also reduces the skilled labor costs associated with supporting and maintaining a network. Right-sizing network capacity can realize cost savings.
- Network security improvements: Monitoring tools with AIOps and anomaly detection capabilities can detect unexpected traffic or unknown devices connecting to the network. These could be early indicators of malicious cyberattacks or ransomware attempts.
- Better planning: Usage spikes and variable network usage patterns can be understood and planned for. This is common in organizations such as universities where class, term and exam schedules can dictate resource demands.
- Rogue devices and applications can be identified: Bottlenecks caused by under resourced, faulty or misconfigured devices can be eliminated. Applications and services that are badly designed and use excessive bandwidth or network resources can be identified.
What are the limitations of, or problems with, Network Monitoring tools?
While network monitoring tools offer significant benefits, they can also have certain limitations that should be considered:
- Blind Spots: Network monitoring tools rely on data collection from specific sources, such as network devices or traffic flows. If certain devices or areas of the network are not monitored or accessible, it can result in blind spots where potential issues or events may go undetected. It's essential to ensure comprehensive coverage across the network infrastructure.
- Scalability: Some network monitoring tools may face scalability limitations when monitoring large-scale networks with a high volume of devices and traffic. As the network grows, the tool may struggle to handle the increased data flow, resulting in potential performance issues or gaps in monitoring coverage. It's important to consider the scalability capabilities of the chosen tool and ensure it can handle the network's size and growth.
- Complexity: Network monitoring tools often come with a variety of features and configuration options, making them complex to set up and maintain. The initial setup and ongoing management of the tool can require expertise and time investment. Monitoring tools that automate this setup and management remove the need for administrators to spend time configuring thresholds, fine-tuning alerting rules, and interpreting monitoring data effectively.
- False Positives and False Negatives: Network monitoring tools may generate false positive or false negative alerts. False positives occur when an alert is triggered for a non-existent or insignificant issue, leading to unnecessary troubleshooting efforts. False negatives occur when a tool fails to detect a genuine problem, resulting in delayed or missed responses. In basic monitoring tools regular manual tuning and fine-tuning of monitoring configurations are necessary to reduce false alerts and ensure accurate detection, using an enterprise ready tool such as eG Enterprise which automatically determines, and tunes thresholds and alerting removes the majority of administrator effort needed by basic tools.
- Protocol and Vendor Limitations: Different network monitoring tools support different protocols and vendors. While most tools support standard protocols like SNMP, they may have limitations when it comes to proprietary protocols or vendor-specific features. It's important to ensure that the chosen tool is compatible with the devices and protocols in your network environment.
- Resource Consumption: Network monitoring tools consume system resources, such as CPU, memory, and disk space, depending on the volume of data being collected and the complexity of monitoring configurations. In some cases, if monitoring is not properly optimized or hardware resources are limited, it can impact the performance of the monitoring tool itself or other network services.
It is important to consider these limitations and carefully evaluate network monitoring tools based on your specific requirements, network environment, and scalability needs. It may be beneficial to conduct a proof-of-concept or trial period to assess how well a tool meets your monitoring needs before making a final decision.
How do AIOps benefit Network Monitoring tools?
Network infrastructures have become more complicated with the introduction of a number of new and heterogeneous devices such as virtual switches, network caches, reverse proxies, secure gateways, connection managers, SAN switches, VOIP devices, and wireless devices.
Modern dynamic IT infrastructures using technologies such as microservices, Kubernetes, containers and cloud often auto-scale and deploy and reconfigure networking.
AIOps (Artificial Intelligence for IT Operations) powered network monitoring tools such as eG Enterprise automate deployment and remove manual configuration ensuring that networking is continually monitored at scale without manual intervention, with features such as:
- Auto-discovery built in. Discover network devices and topologies
- Implements vendor-recommended best practices for network monitoring
- Collects metrics like packet drops from queues, buffer overruns, etc., and detect problems well before they become business impacting
- Auto-baseline metrics for every device. Alert when abnormal usage or traffic patterns are noticed
- Auto-discover network topologies and differentiate cause of problems from effects, thereby facilitating faster problem resolution and lower MTTR
- Built-in trend analysis and forecasting capabilities
What capabilities does eG Enterprise include for Network Monitoring via SNMP?
eG Enterprise provides unified monitoring of all network devices from one console, enables problems to be clearly demarcated and alerts to be proactively triggered of problems well before users notice. Features include:
- Out of the box for polling standard SNMP MIBs: Host Resources MIB, MIB-II, IP SLA MIB, Printer MIB, Fiber Channel MIB, etc.
- Support for Vendor-specific MIBs including Cisco, Fortigate, Checkpoint, EMC and others
- Support for SNMP v1, v2, and v3 over TCP or UDP transport
- Built-in SNMP trap receiver capable of receiving and processing traps
- Monitor any SNMP-capable device including thermostats, data center sensors, printers, switches, hubs, routers, IoT (Internet of Things) devices
What popular open-source and free Network Monitoring tools are available?
There are many open-source and free network monitoring tools available. Popular choices include: Nagios Core, Grafana, Zabbix, Cacti, LibreNMS, Icinga and Observium.
There are many good free and open-source tools for monitoring networking. However most require significant manual effort and some level of skills to implement, moreover at scale and for organizations who have a need for high-availability and a commitment to user service find they need a supported commercial tool. Some of the pros and cons of some open source vs. commercial tools are covered in: Top Freeware and Open-source IT Monitoring Tools - IT Glossary | eG Innovations.
Enterprise tools will typically offer additional functionality such as synthetic testing tools, whereby robot users proactively simulate real users and workloads using the network. Synthetic monitoring tool features proactively test networking paths even when there are no real users so administrators can detect and resolve issues before networks become busy and in-demand and real users encounter the issues.
What does an MSP (Managed Service Provider) need from a network monitoring tool in a multi-tenancy environment?
In a multi-tenancy environment, Managed Service Providers (MSPs) require specific features and capabilities from a network monitoring tool to effectively manage and monitor the networks of multiple clients.
eG Enterprise is one of the few products capable of supporting multi-tenanted MSP environments. Here are some of key requirements for an MSP in a multi-tenancy environment that eG Enterprise offers:
- Multi-Tenancy Support: The network monitoring tool should provide built-in support for multi-tenancy, allowing the MSP to create separate and isolated monitoring environments for each client. This ensures that clients' network data and configurations remain separate and secure.
- Centralized Management: The tool should offer a centralized management console or dashboard that allows the MSP to monitor and manage multiple client networks from a single interface. This includes the ability to view and analyze data from all client networks, configure monitoring settings, and generate reports.
- Scalability and Performance: The networking tool should be scalable and capable of handling a large number of devices, network traffic, and monitoring data. It should handle increased loads and maintain optimal performance even as the number of clients and network resources grows.
- Role-Based Access Control: The tool should support Role-Based Access Control (RBAC), allowing the MSP to assign different access levels and permissions to clients and their respective administrators. This ensures that each client can access and manage only their own network data and configurations.
- Customizable Dashboards and Reporting: The tool should offer customizable dashboards and reporting capabilities, enabling the MSP to tailor the monitoring views and reports to meet the specific needs of each client. This allows clients to have a personalized view of their network performance and receive reports aligned with their requirements.
- Alerting and Notifications: The networking tool should provide robust alerting and notification mechanisms. It should allow the MSP to configure alerts based on specific thresholds or conditions and deliver notifications to the appropriate client administrators. Flexible alerting options, such as email, SMS, or integration with ticketing systems, can help ensure timely response to critical network events.
- Billing and Integration: The tool should facilitate accurate tracking of resource usage and billing for services provided to clients. It should support generating billing reports and integrating with billing systems or platforms. This simplifies the billing process and ensures accurate invoicing for each client.
- API and Integration Capabilities: The networking tool should offer APIs (Application Programming Interfaces) or integration capabilities to facilitate seamless integration with other systems and tools used by the MSP. This allows integration of network monitoring data with other systems such as ticketing systems, reporting tools, or service management platforms.
By fulfilling these requirements, eG Enterprise is a network monitoring tool which can effectively meet the needs of an MSP operating in a multi-tenancy environment, enabling efficient management, monitoring, and service delivery for multiple clients.


