Why is the Java Application Slow?
The performance of any application is measured by its availability and responsiveness. When an application is slow, IT operations staff must troubleshoot the cause of slowness, identify it and resolve it. While application performance problems may be caused by issues in the supporting infrastructure, often the issues are related to the application components themselves. Poor application design, inefficient methods, loops in Java code, and badly constructed database queries are some of the common causes of poor Java application performance. Slowness can also stem from external accesses from the application code. For example, the Java application may be making a web service call to a remote transaction processing service which may be slow, or the application may be sending email using Java Mail API and slowness in the mail system may be causing the application to be slow.
Byte-Code Instrumentation: Transparent Instrumentation of Java Applications
Application performance monitoring tools are focused on detecting, diagnosing and helping fix such application slowness issues. A simple way to troubleshoot an application is to modify it so the application logs at every stage how long each method call, or loop, or database query took to execute. A key problem with this approach is that it requires the application developers to change their code to support logging of performance at every stage. This is not only time-consuming, but it may not be feasible in some situations. For example, consider a commercial off-the-shelf (COTS) application like the Cerner healthcare application, which operates on Java technologies. Organizations do not have access to the source code to make modifications.
Therefore, it is essential that application performance monitoring solutions can discover slow method calls, inefficient database queries, infinite loops and such without requiring changes to the application code itself. This is where byte-code instrumentation comes in.
Byte-code instrumentation is a technique for changing the code of compiled Java applications, either before running them on the disk or “on the fly” as they are loaded into memory. A key advantage of this technique is that it adds monitoring capabilities to applications without having to modify the monitored code manually.
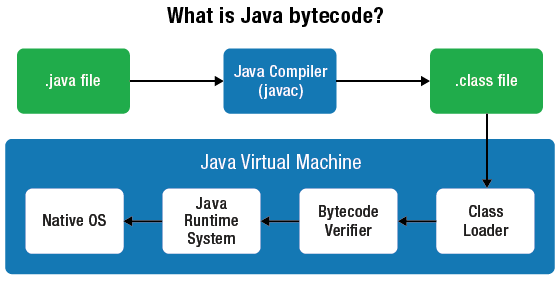
Java is a dynamically loaded language. Every class is loaded lazily when needed using a component called a class loader. The class loader looks for the class code, reads it, and passes it to the JVM, which links it with the rest of the code that is already loaded. This behavior makes Java very flexible – selection of concrete classes is deferred to the last possible moment. The compiled code itself is kept in bytecode format – an intermediate language, which resembles assembly language.

Understanding Java compilation, loading and execution
Normally, the class loader just reads the class file from wherever it is stored and passes it to the JVM as an array of bytes. Modern Java runtimes (1.5 and higher) provide a special instrumentation API that gives monitoring tools access to the bytecode of every class right before it is loaded. This is how monitoring tools add instrumentation to monitor applications without requiring code changes to each application.
Transaction Tracing: Putting Together an Application Execution Map
Byte-code instrumentation provides details of what line of code, method, call, etc. is executed at each Java tier. By analyzing the code that is executed for each web/mobile request to each tier, it is possible to determine where time is spent in the application code in that tier. To get a complete transaction flow map, APM tools implement a tag and follow methodology. A unique tag is assigned to each request when it first enters the application code and this tag is passed through each application processing tier. Based on the metrics collected at each tier, a transaction flow map is then put together for that request. The figure below depicts a transaction flow map.
Visualization of application transaction execution using transaction tracing
Here, you can see the overall transaction processing time as well as the time spent in each tier of the application. This helps IT operations staff quickly determine which tier is responsible for the transaction slowness.
Drilldowns into each tier highlight the exact stack trace. From this stack trace, you can see which line of code has contributed the most to the transaction processing time. Likewise, the database queries executed during transaction processing and the time taken for each query can be detected.
Code-level diagnosis pointing to the exact line of Java code that is slow to execute
How Transaction Tracing Helps with Java Application Performance Diagnosis
Using the transaction flow map, it is possible to determine: |
|---|
|
This information is extremely helpful in determining who needs to handle the application slow complaint: is it the Java developer, the database administrator, the external service administrator, or something else?
Transaction tracing has grown in popularity over the years and is now an important component of any APM deployment. Some of the main reasons for this are:
eG Enterprise is an Observability solution for Modern IT. Monitor digital workspaces,
web applications, SaaS services, cloud and containers from a single pane of glass.
- The ability to eliminate finger-pointing and war room scenarios during problem diagnosis
- Ability to instrument applications without needing code-level changes
- Capability to diagnose application performance issues without needing any changes in the supporting application tiers. This is a key reason. Database administrators, for example, may not want to add agents to allow the application developers to monitor their systems. Transaction tracing helps application developers highlight the time spent on the database tier as a portion of the overall transaction tracing time. This can help point out to the database teams the times when database processing is slowing down the application.